Visualization of DNA-protein interactions
In this experiment, a DNA molecule is tethered between two beads while multiple fluorescently labeled proteins are interacting with it. We can visualize these interactions and track them over time using multicolor confocal or STED fluorescence microscopy. The resulting kymograph unveils the number, position, diffusion, and (un)binding events of the proteins along the DNA.
In this proof-of-concept experiment, the kymograph in figure 1 shows the position of bound XRCC4 and XLF on DNA over time at protein concentrations of 5 nM. These are two repair proteins involved in non-homologous end-joining which can associate with each other to form complexes capable of bridging DNA. From the figure we can observe and quantify the dynamics (N=94 events) of XRCC4 (green, 9%), XLF (red, 62%), and XRCC4-XLF complexes (yellow, 29%).
The kymograph gives real-time insights in the DNA-protein interactions and protein-protein interactions involved in DNA repair. Simultaneous force and extension measurements allow correlating the protein activity and binding kinetics with the mechanical properties of the protein-DNA complex.
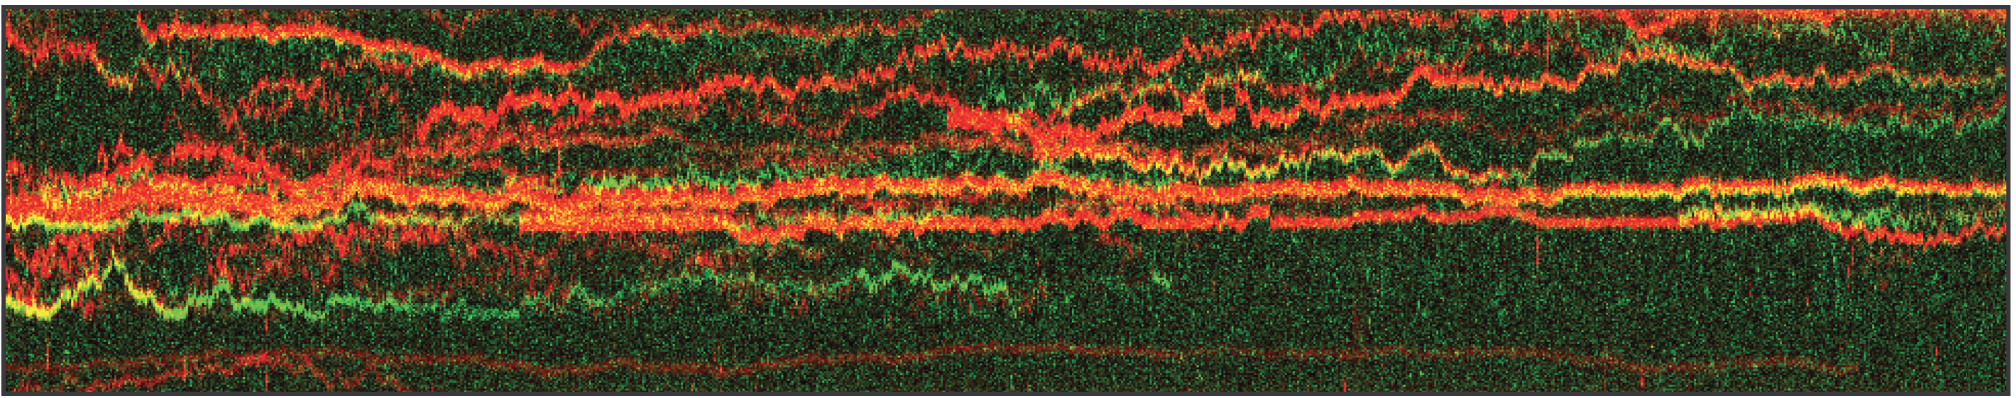
1 Kymograph showing the dynamics of XRCC4 (green), XLF (red), and XRCC4-XLF complexes (yellow) on DNA.
Application note | STED
Brouwer et al. (2016) Nature
Investigation of ribosome activity and states
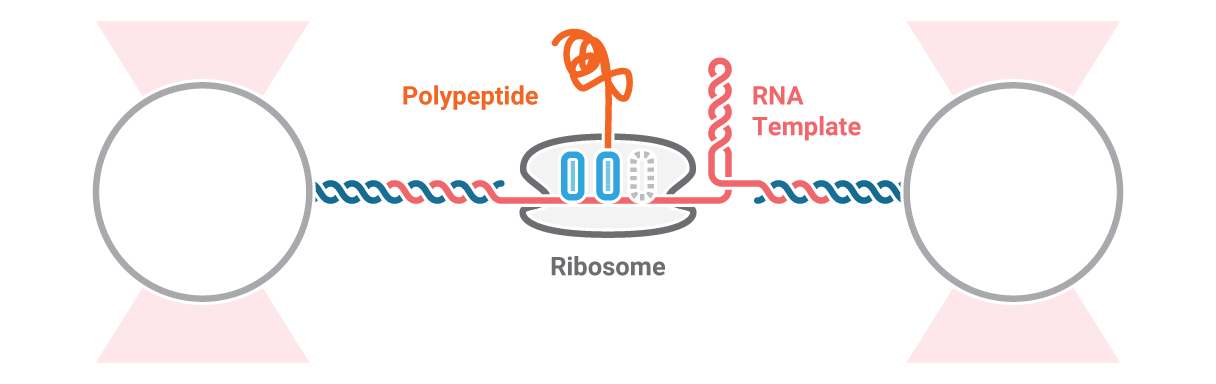
Here, an RNA molecule is tethered between two optically trapped beads and a ribosome translating it into a polypeptide. Next, we measure the activity of the ribosome as it translates the RNA template into protein. This is done by stretching the RNA with a constant force and simultaneously measuring the distance between the beads.
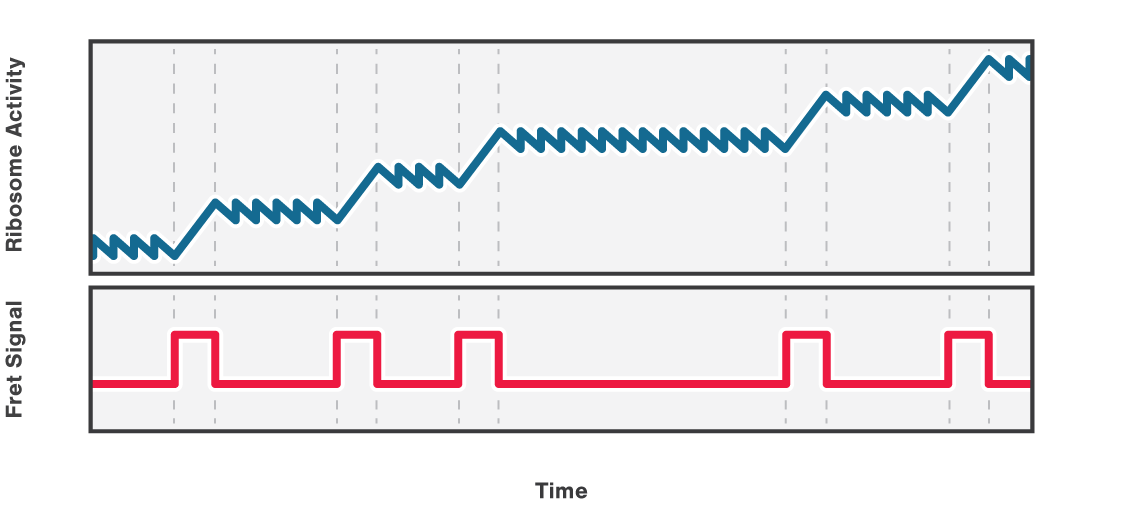
Figure 2 (top) shows the activity of a ribosome across an RNA molecule. As the ribosome translates the RNA fragment, it becomes shorter and the end-to-end distance between the two beads lessens proportionally. This enables us to measure the activity and states of translation proteins as well as the kinetics and formation of nascent proteins.
Also, multicolor fluorescence detection allows quantifying the FRET efficiency changes of a labeled ribosome in time. In this way, we can correlate a certain conformational change of the ribosome with its activity bursts (Figure 2, bottom).
2 Schematic showing the activity of a ribosome across an RNA molecule (top) and the corresponding FRET signal (bottom) across time.
Measurement of riboswitch conformational changes
Here, an RNA polymerase (RNAp) is caught and tethered between a bead and the nascent RNA strand. As the nascent RNA emerges from the RNAp the molecule begins to fold immediately forming riboswitches. We can follow the states and activity of the formed riboswitch, by stretching the tether with a constant force and measuring the distance between the beads.
Figure 3 shows the results of an experiment where we stretched and relaxed the RNA molecules with a constant load (10 nm/s, blue) while recording the force-extension curves. At approximately 8 pN we observe an unfolding rip, approximately 15 nm long. When we relaxed the molecule the refolding curve followed the same path as the unfolding, which corresponded to a rip of similar size. This shows that the unfolding of the RNA molecule is a reversible process. Cycles of unfolding and refolding could be repeated multiple times with the same result.
In the second experiment, we evaluated the structural transitions of our RNA target molecule over time. To this end, we brought a single RNA molecule to a specific pretension and studied its transitions. Figure 4 shows two major states at tensions around 6.2 pN and 7.2 pN, while a third conformational state was also occasionally accessed.
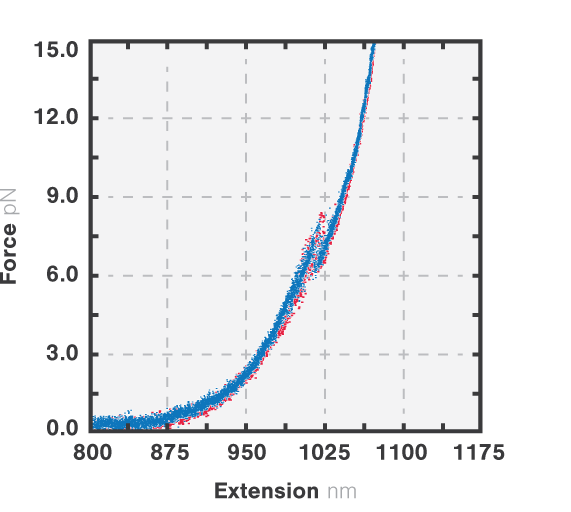
3 Force-distance curves corresponding to the extension (red, 10 nm/s) and retraction (blue, 10 nm/s) of a single RNA tether.
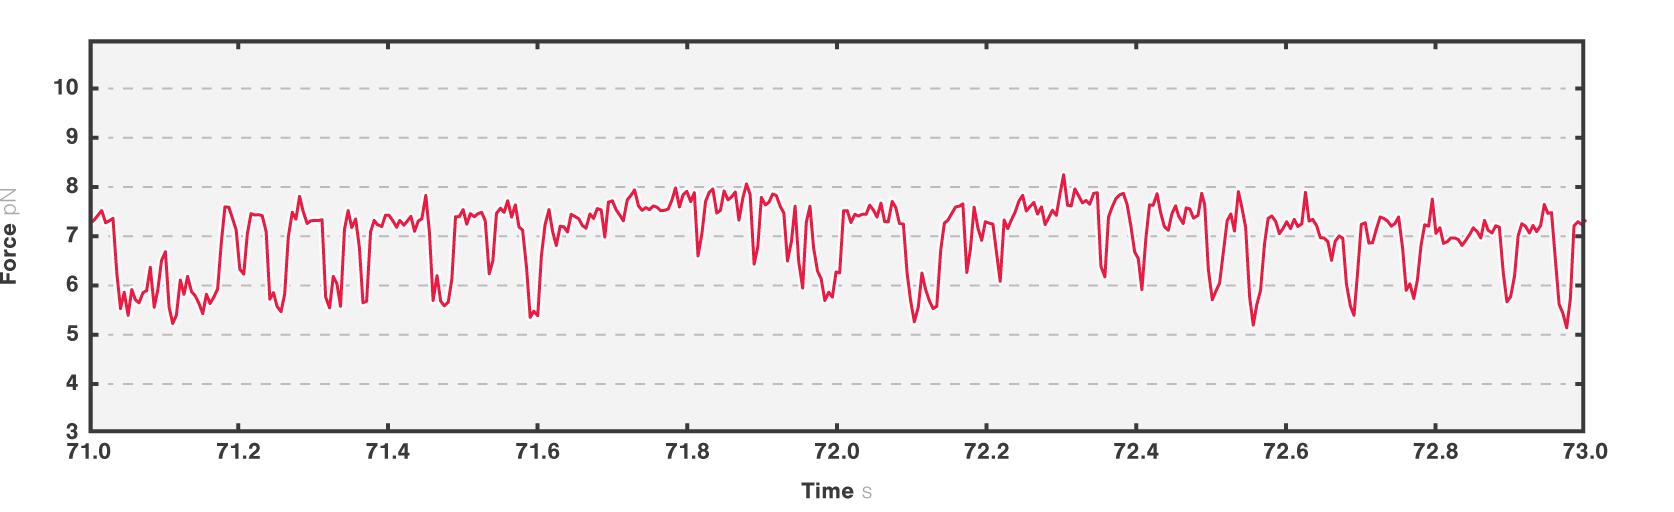
4 Two-second time trace of a single RNA molecule held at an initial tension of ~7 pN. Dashed black lines show different possible visited states.