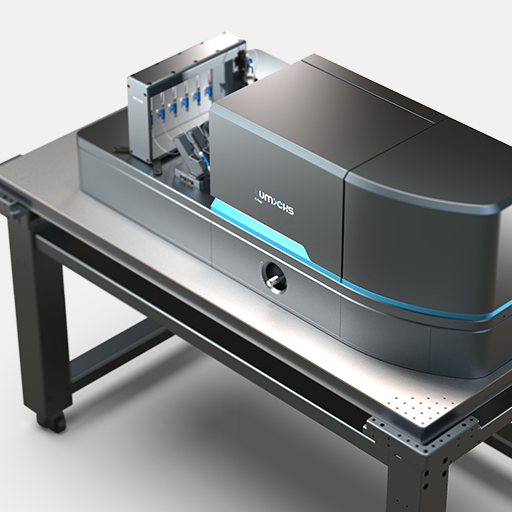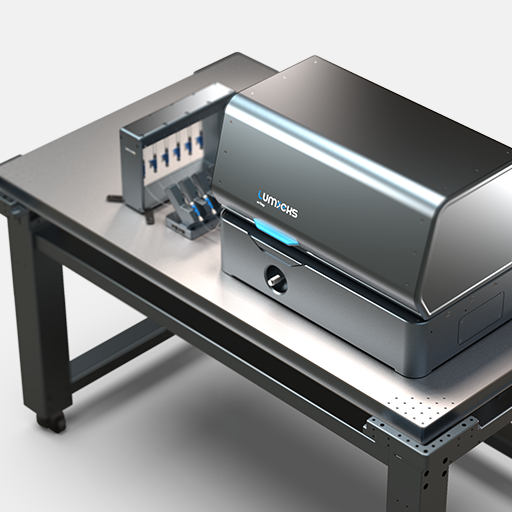
DNA transcription is the key element that defines cellular identity and status. By clearly understanding the mechanism of gene regulation and expression at this level scientists will be able to grasp many causes of diseases and develop possible cures. Until now, molecular biology and biochemistry methods have highly contributed to uncovering the transcription mechanism. However, without looking at the dynamics of the individual components in real-time and at the molecular level, it will not be possible to fully comprehend this complex process.
C-Trap® Optical Tweezers – Fluorescence & Label-free Microscopy provides exactly these capabilities, empowering your research to gather valuable insights into the detailed mechanisms governing DNA transcription.
Visualization of DNA-protein interactions
The unique combination of optical tweezers and different microscopy techniques, allows it to isolate a single DNA molecule and observe the interactions of DNA-binding proteins in real-time, displayed in a kymograph. Due to the flexibility of the system, the researcher has the choice which visualization technique to apply for the current experiment. To be able to visualize the dynamics of individual proteins at biologically relevant concentrations, the high spatial resolution of STED microscopy is preferred as it provides higher sensitivity than confocal microscopy, as shown in this assay.
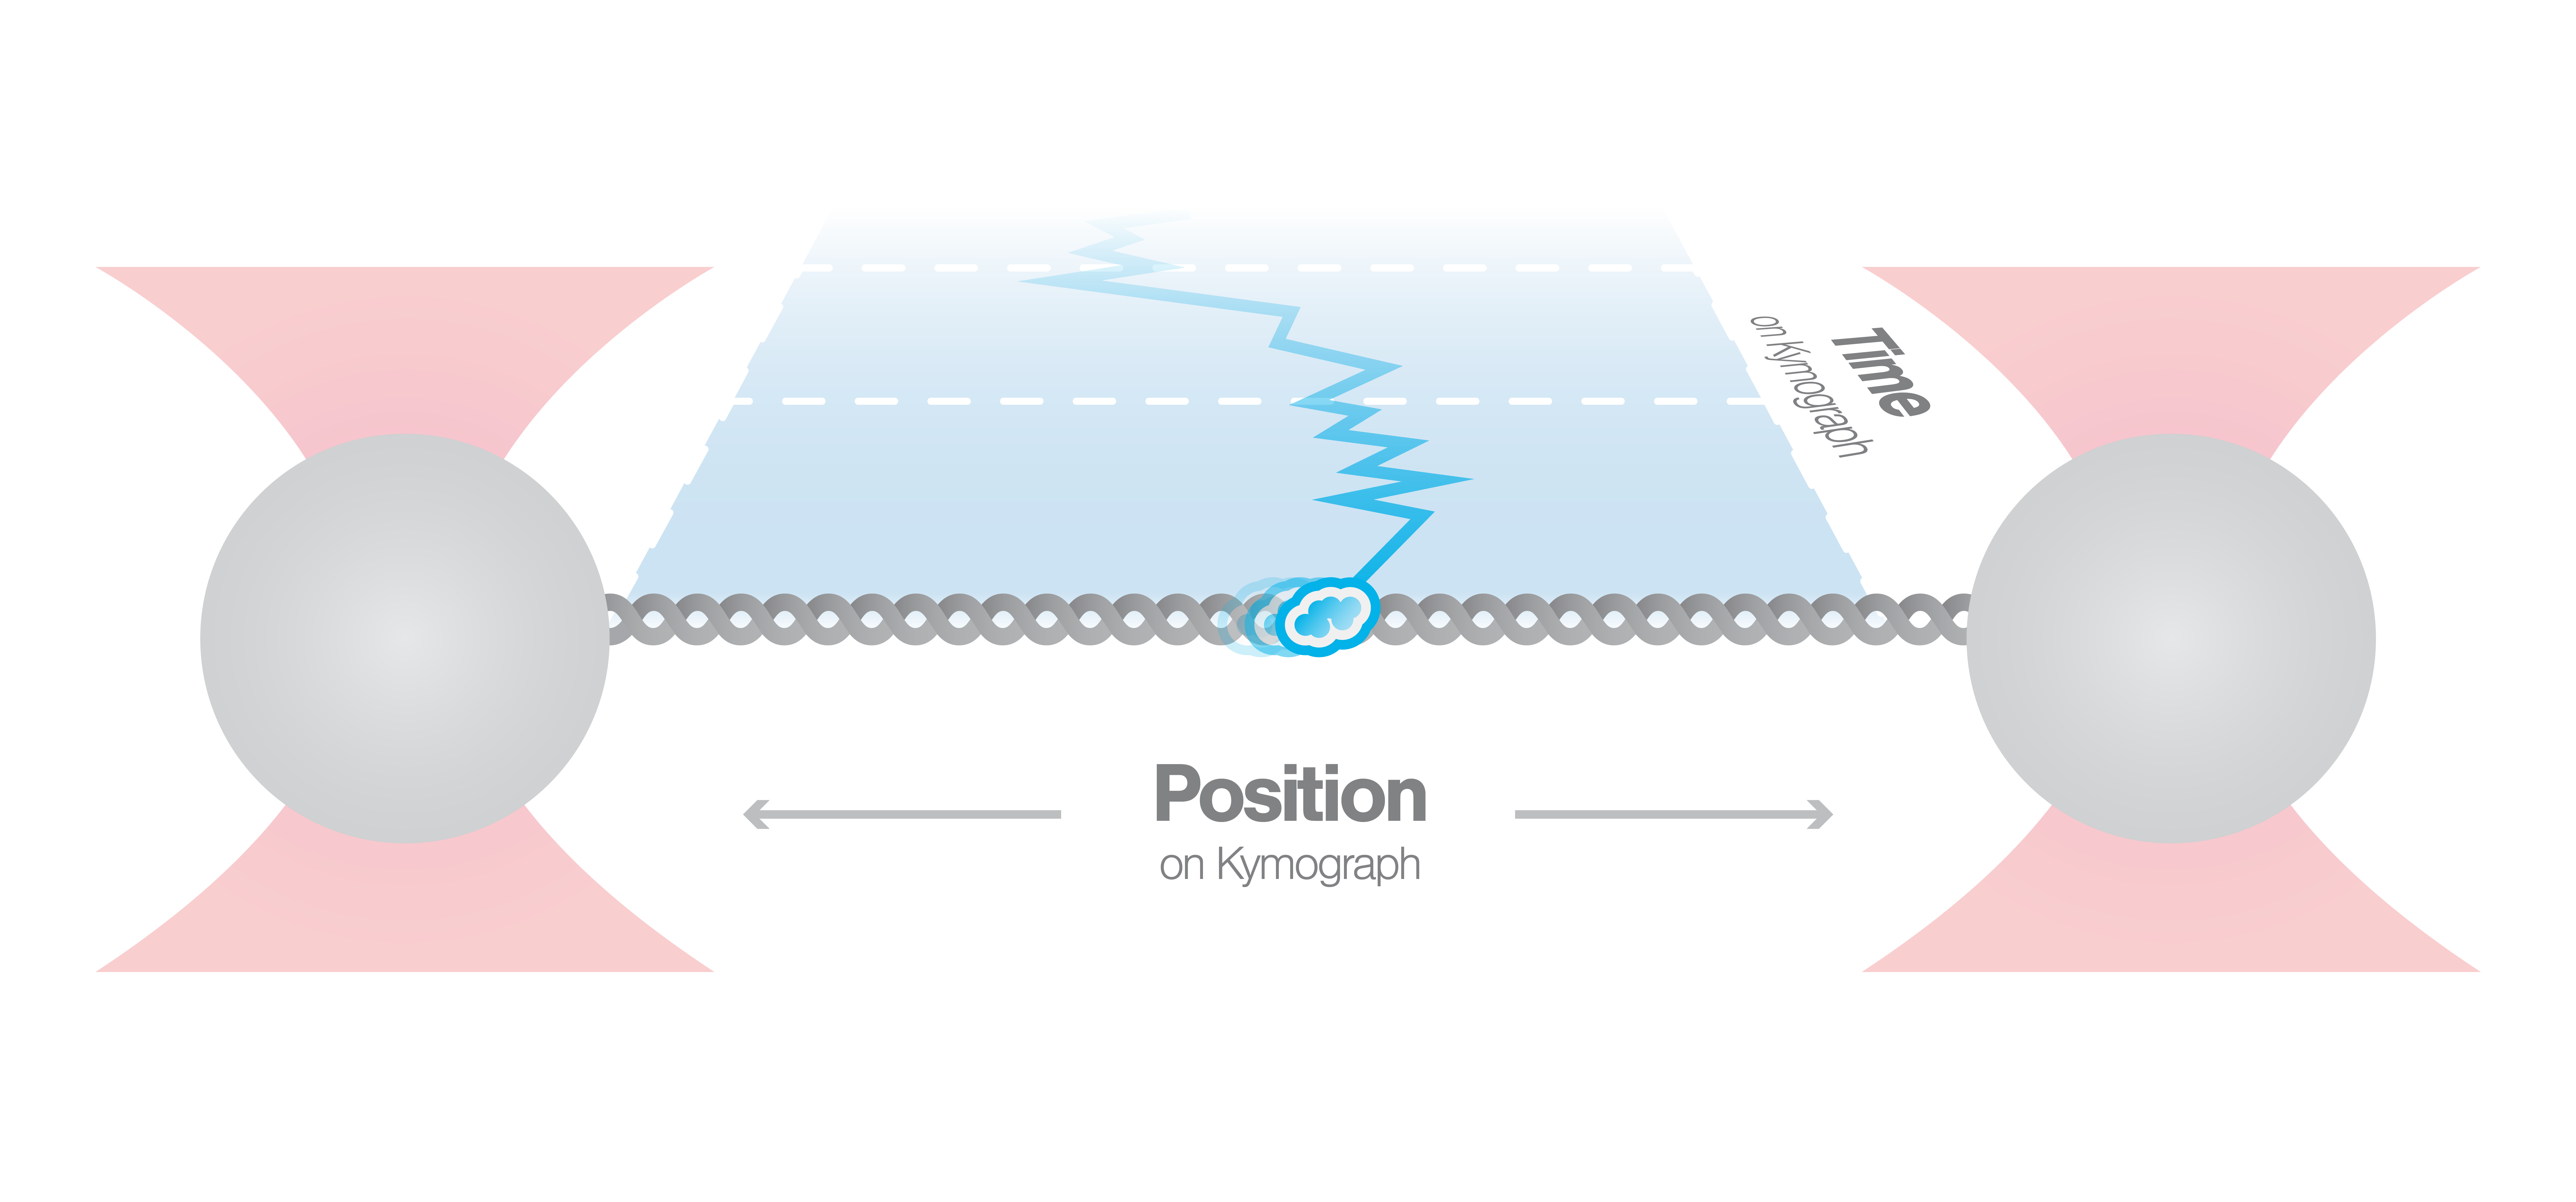
The human mitochondrial transcription factor TFAM is a DNA-binding protein that is important for mitochondrial DNA organization and transcriptional activation. In vivo, TFAM is present in abundance and can coat the entire mitochondrial genome. To mimic this situation in vitro, scientists from the labs of Prof. Gijs Wuite and Prof. Erwin Peterman used high TFAM concentrations to study TFAM-coated DNA.
Figure 1 shows a kymograph displaying DNA-bound fluorescently-labeled TFAM proteins, plotted over time. Fluorescence signals that could seem like stably-bound filaments using confocal microscopy (left), can be resolved as individual TFAM protein trajectories, diffusing within otherwise diffraction-limited regions. The flexibility of the C-Trap allows it to adjust the system based on your experimental requirements – as for example using the high spatial resolution of STED microscopy to analyze dynamics of DNA-binding proteins at biologically relevant concentrations.

Figure 1 Kymograph of the dynamics of human TFAM-Atto 647N on λ-DNA using confocal microscopy (left) and STED microscopy (right).
Application note | STED
Heller et al. (2013) Nature Methods
Real-time observation of DNA exonuclease dynamics at base-pair level
The high spatial sensitivity of the C-Trap/m-Trap optical tweezers systems makes it possible to measure changes in DNA length at the nanometer level. This capability can be used to indirectly measure the activity of enzymes as they process DNA molecules.
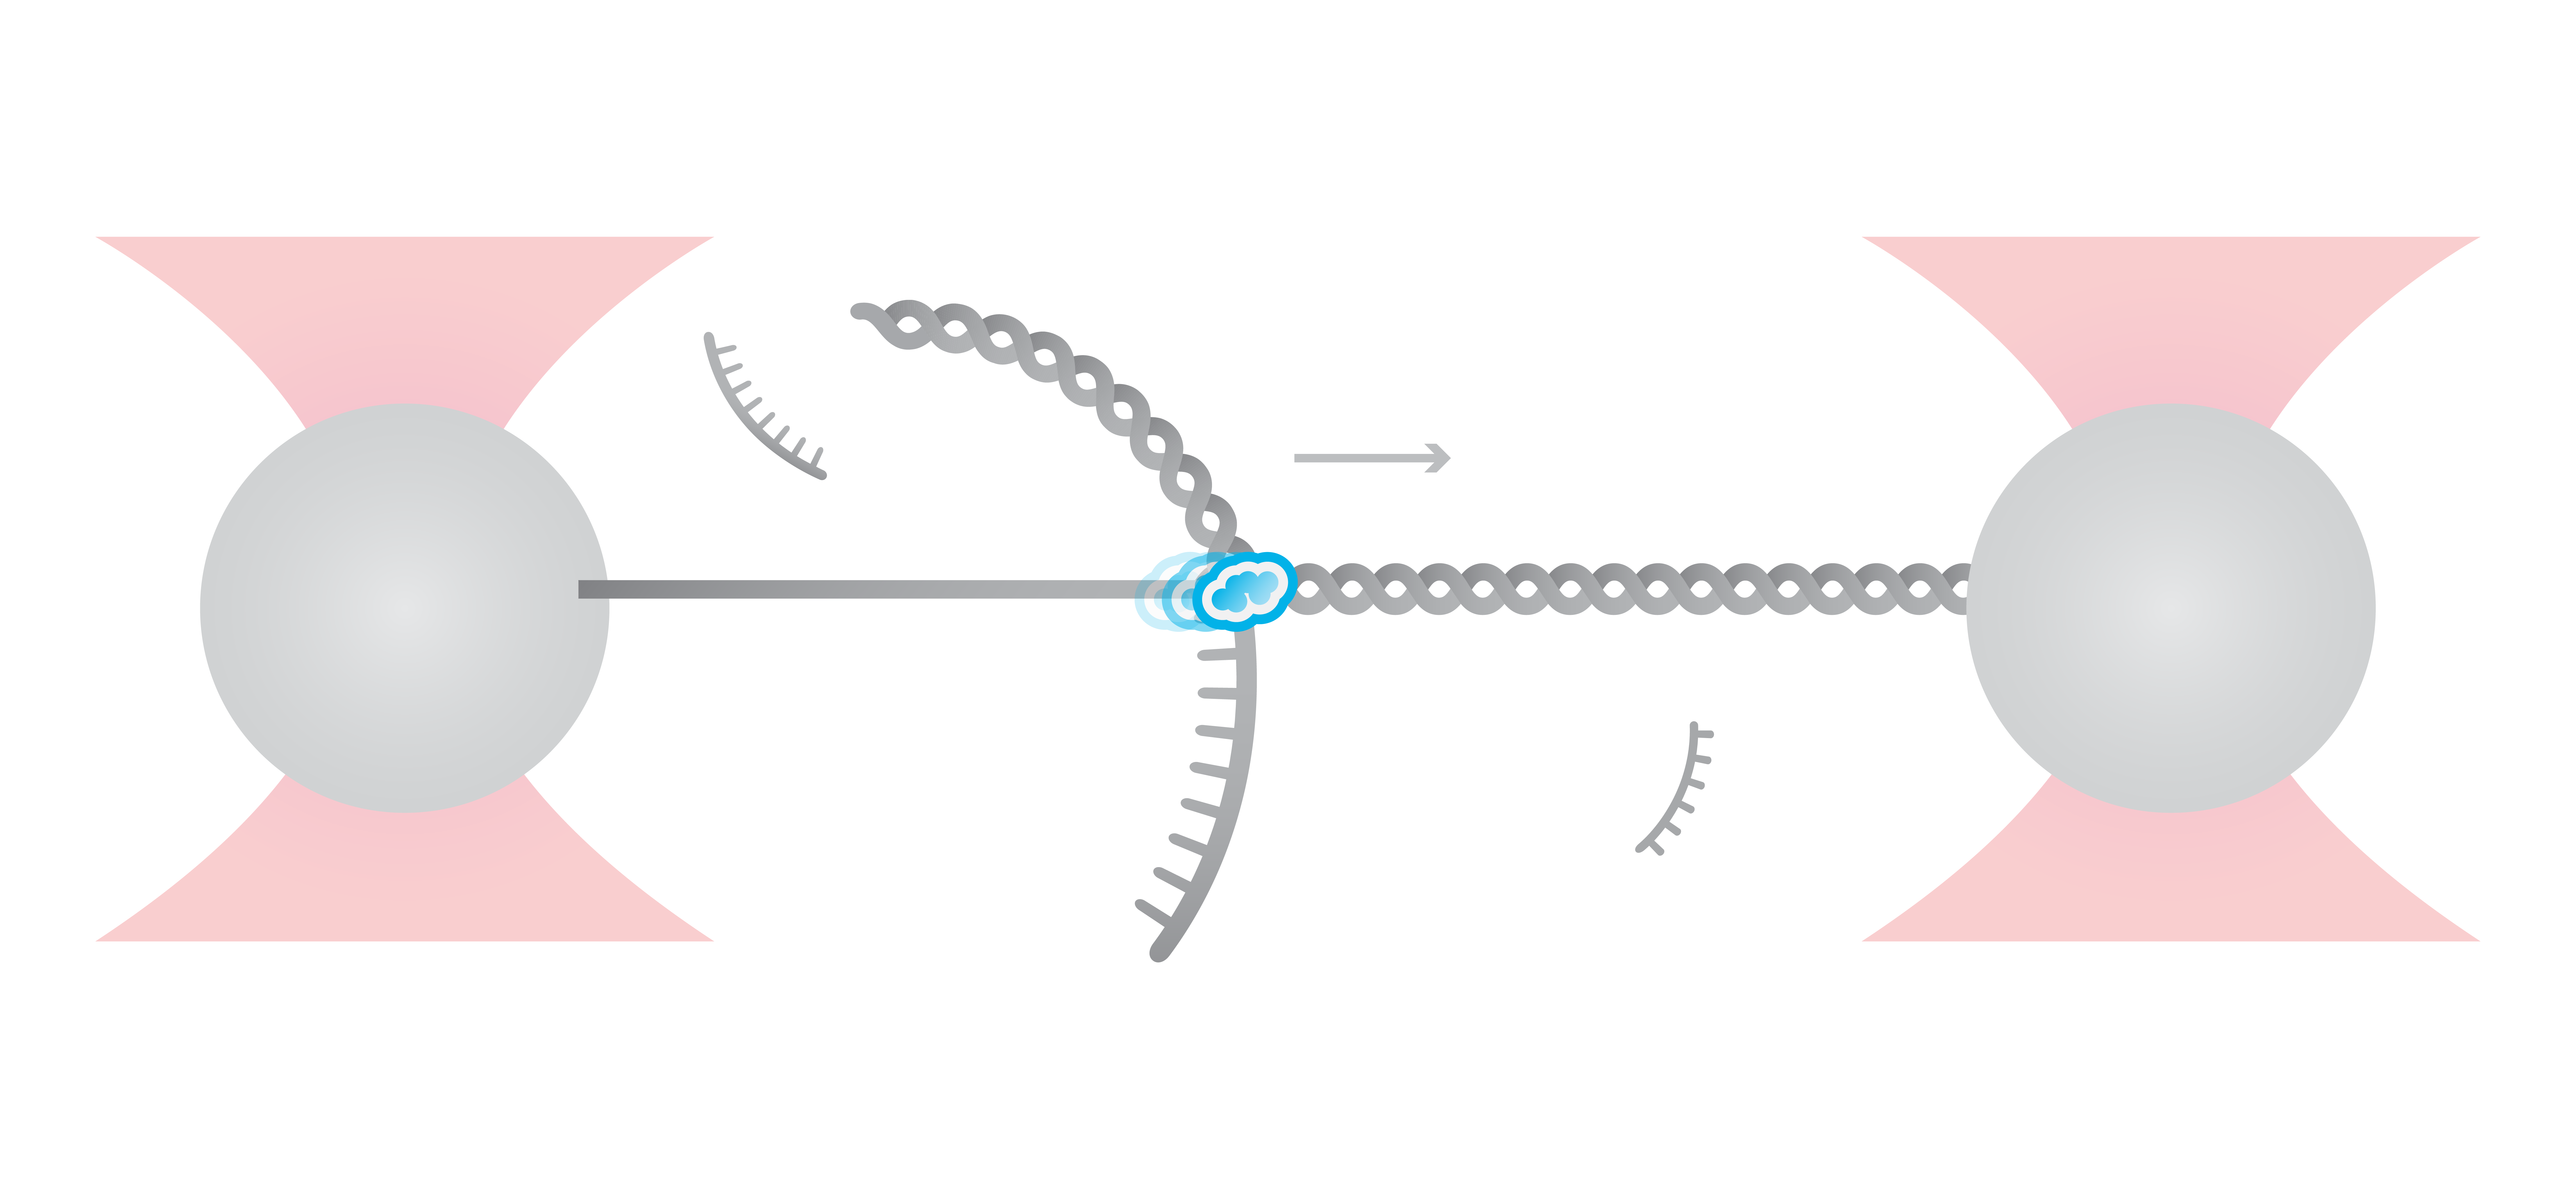
In this experiment, the exonuclease activity of the T7 polymerase was investigated. This is a DNA polymerase from the T7 bacteriophage that copies DNA strands in the 5’→ 3′ direction, and also features exonuclease activity. For this analysis, an optically trapped double-stranded DNA was held at a constant force that induced exonucleolytic activity of the polymerase. By removing nucleotide after nucleotide from one strand, the polymerase was unwinding the dsDNA. As the length of single-stranded DNA is longer compared to its double-stranded state, the unwinding resulted in a gradual increase in the end-to-end distance of the DNA (Figure 2 a). This change in length was directly translated into the activity of the T7 DNA polymerase and the number of nucleotides it processed over time (Figure 2 b). Specifically, short activity bursts ranging between 3 and 10 nucleotides were revealed, interspersed by frequent pauses of varying duration. This provided deeper insights into the dynamics of T7 exonuclease activity.
The m-Trap and C-Trap Optical Tweezer systems are highly valuable in providing novel insights into the mechanism of DNA-processing enzymes, as they enable performing single-molecule measurements of the stepping behavior of biomolecular motors along nucleic acids.
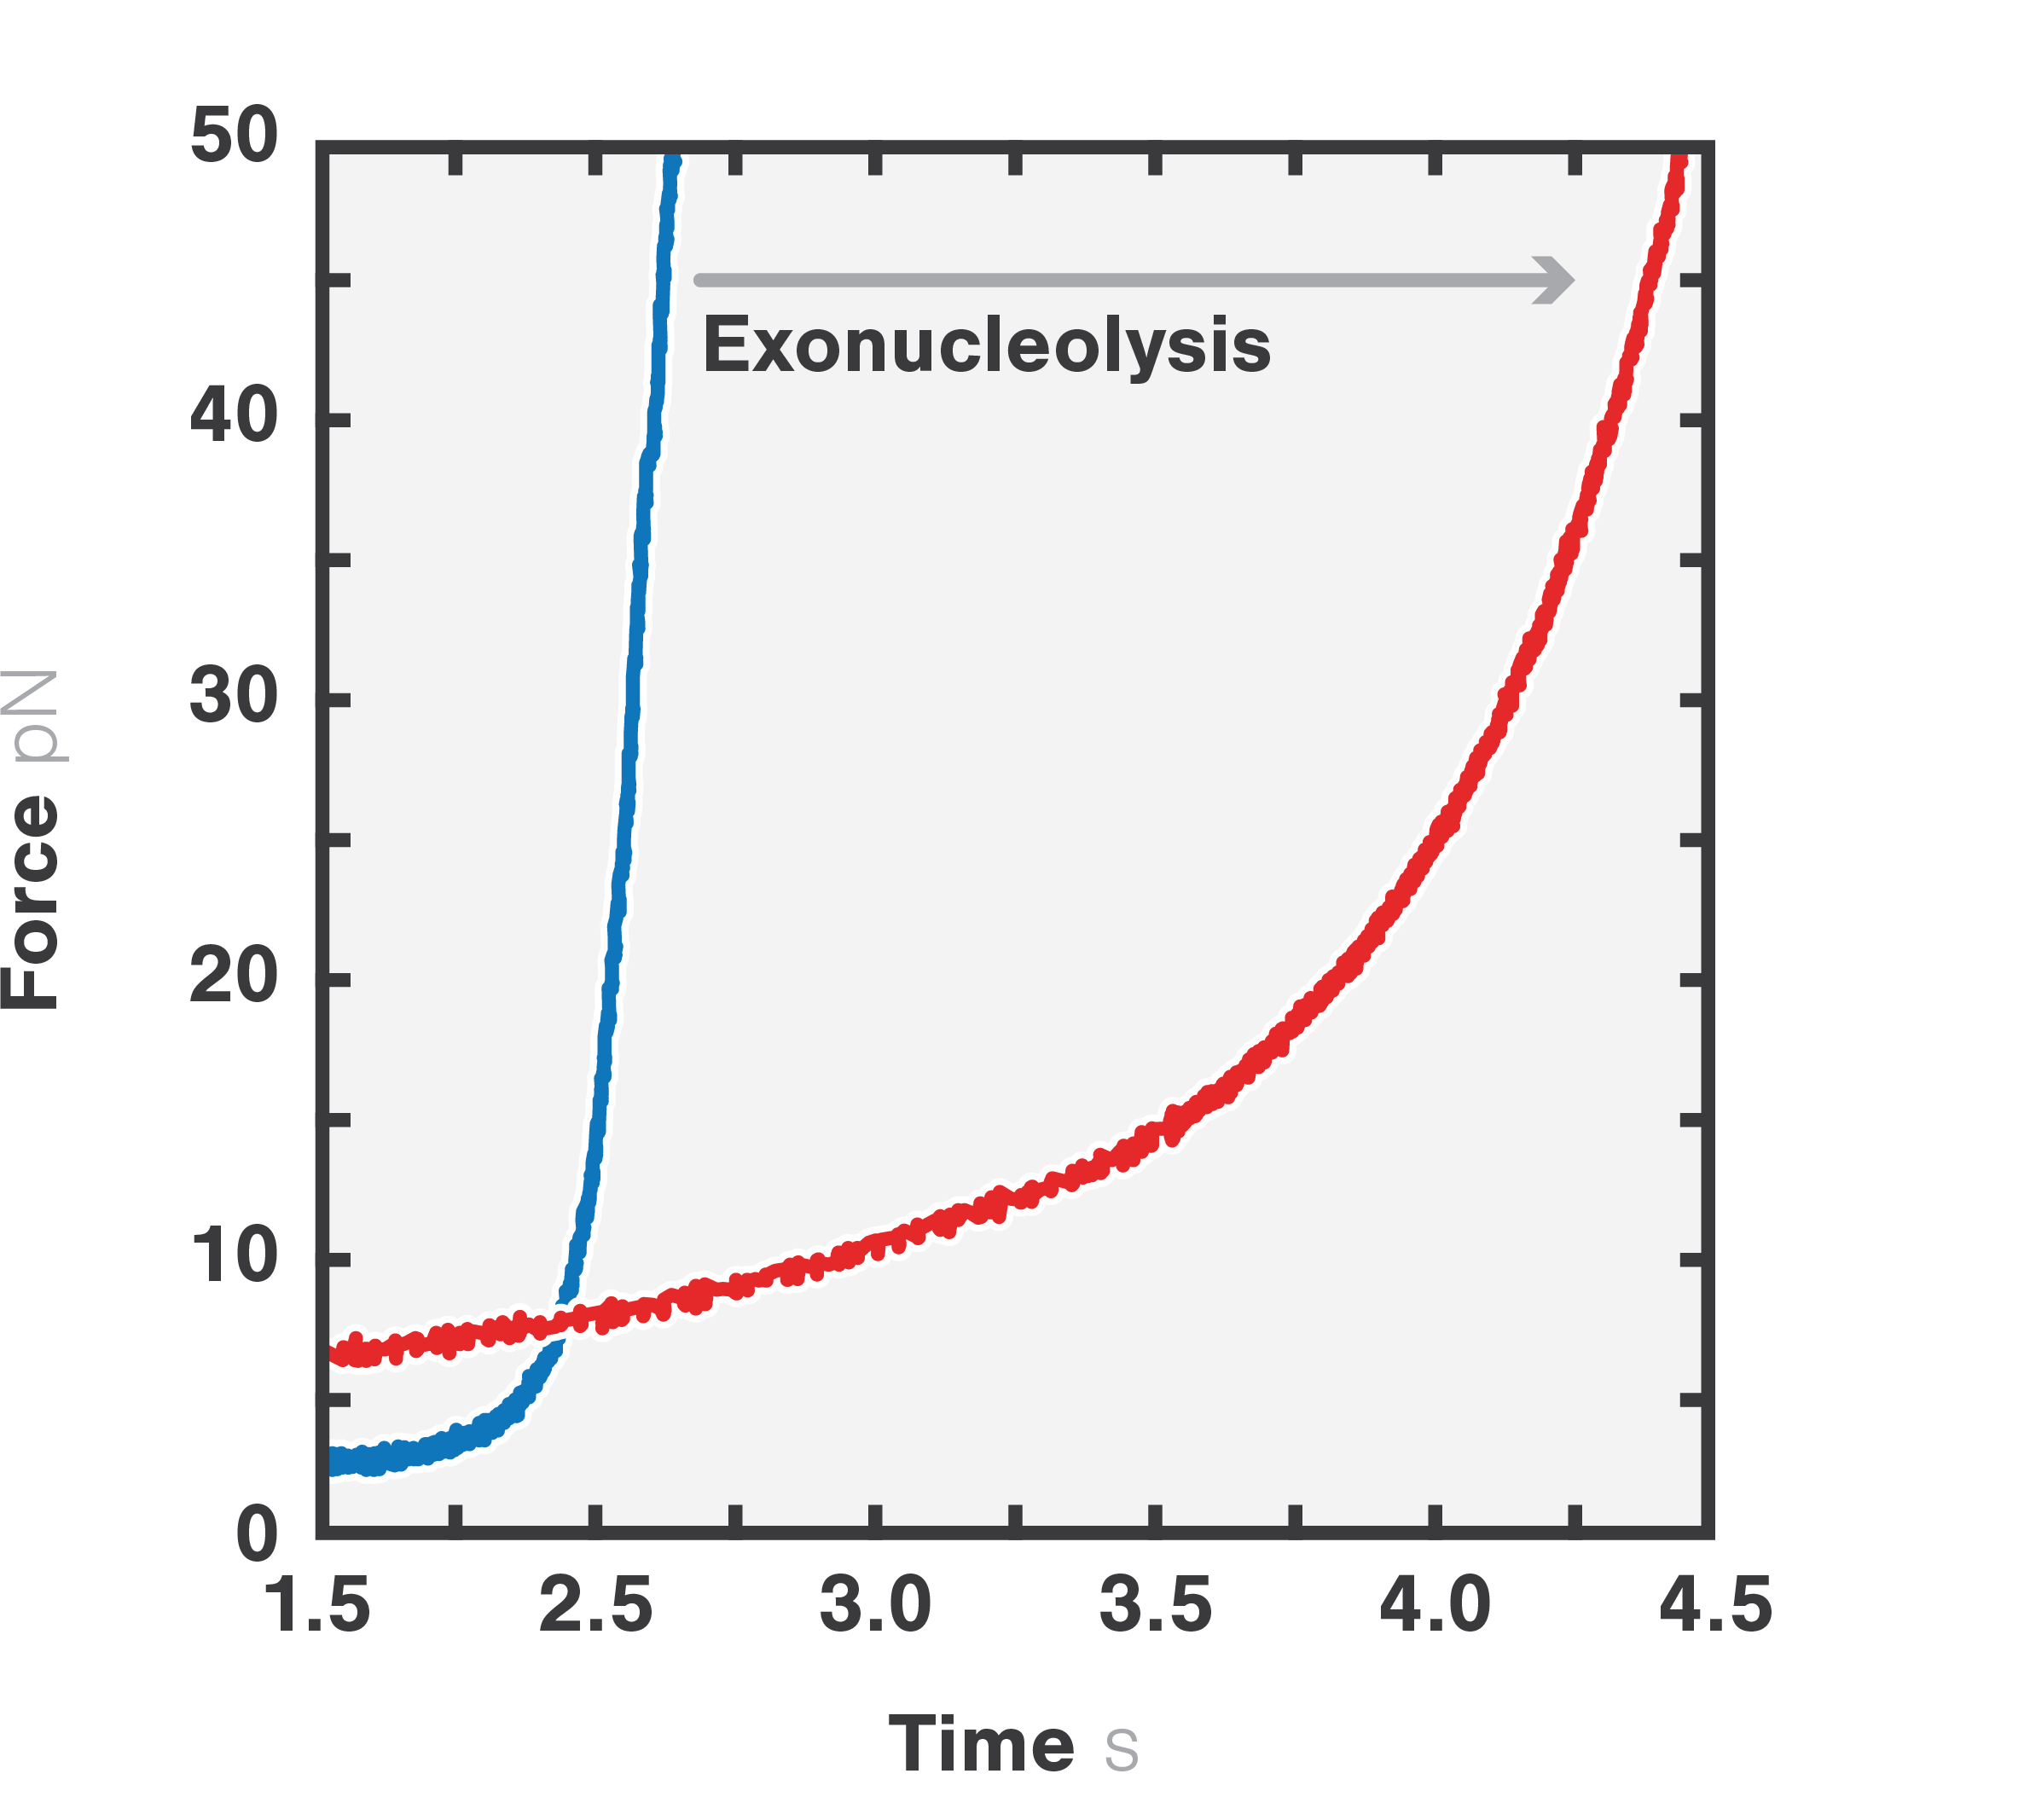
Figure 2a Force-distance curve of double-stranded DNA (blue) and single-stranded DNA (red).
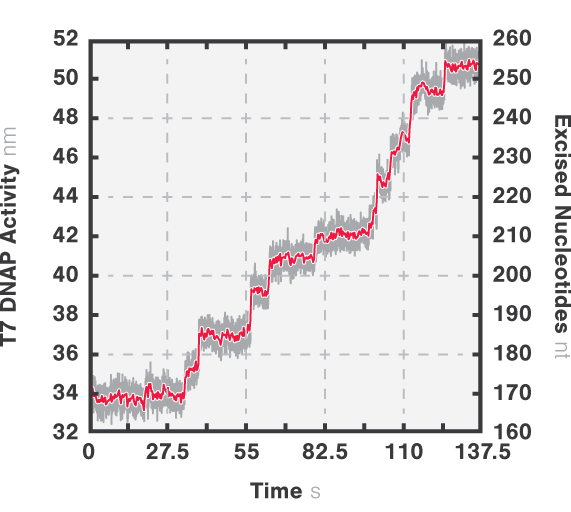
Figure 2b Activity bursts of T7 DNA polymerase performing force-induced exonucleolysis on a double-stranded DNA.

